|
Stackable Microcontroller (uC) System |
| PCB Circuits (click to enlarge) | Info |
|
ATmega328P Working System (Click for short .mp4 video) |
Overview This module takes you through building your own Arduino Uno-like microcontroller using through-hole components. Initially you can build it on a breadboard to test every circuit, then review my production PCB version possibly to build your own base board. Unlike the Arduino Uno R3, it contains an SD module and an RTC (realtime clock) for datalogging.
As part of this stacked system, you could also build an expansion board. It contains all of the bits needed to build a weather module and it plugs into the base board. Initially, you could build it on a breadboard and then on a production PCB.
Both boards can be populated with through-hole parts which can be soldered by you with a bit of practice.
The result will be a small data logging system that will record to SD card: - temperature, humidity, barometric pressure, etc.
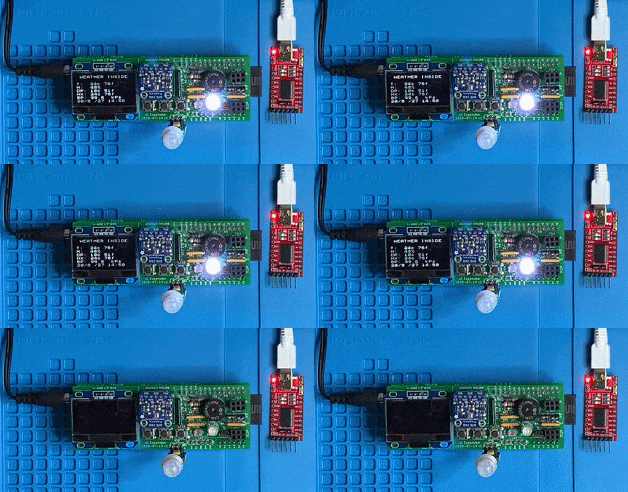
In the adjacent video (click on the .gif for a short video), the OLED display on the left is blank. When the white PIR at the bottom of the module detects motion, it turns on an RGB LED as well as the OLED display which will show: - temperature in C and F - humidity % - dew point in C and F - humidex in C and F - barometric pressure in kilo Pascals (kPa) - date and time
For demonstration's sake, the OLED-on time is limited to 5 seconds. Normally it would be about 10 seconds - whatever time it normally takes for you to quickly read the display.
Also for demonstration, a melody/tone is played every 10s when the stats listed above are written to SD. (You can hear it if your PC speaker is turned up.) Normally you would want it logged every 60s or so. The time when the OLED displays and when the SD card is written are independent processes.
The stats file is saved as THBP.txt to the SD card. Within Excel or some spreadsheet program, you can select the columns of data listed above you may wish to graph.
Prospective Coding Additions/Changes 1) Use the 3 buttons to change the configuration: degrees F instead of C, BP in kPa or mmHg or inHG 2) Have the LDR detect when the light level is low (night time?) so the display is not turned on unnecessarily 3) Play a tone only if the SD card is running out of room instead of when writing stats to SD card 4) Display the RGB LED only when the light is low and motion is detected 5) Monitor the BP every minute for an hour to determine if it is stable, rising or falling. Display state with an arrow symbol 6) Lots of ideas... |
Tags: Arduino-type Microcontroller, ATMega328P
